Sales Performance Dashboard — Abuja
Problem: Unclear profit trends across product lines
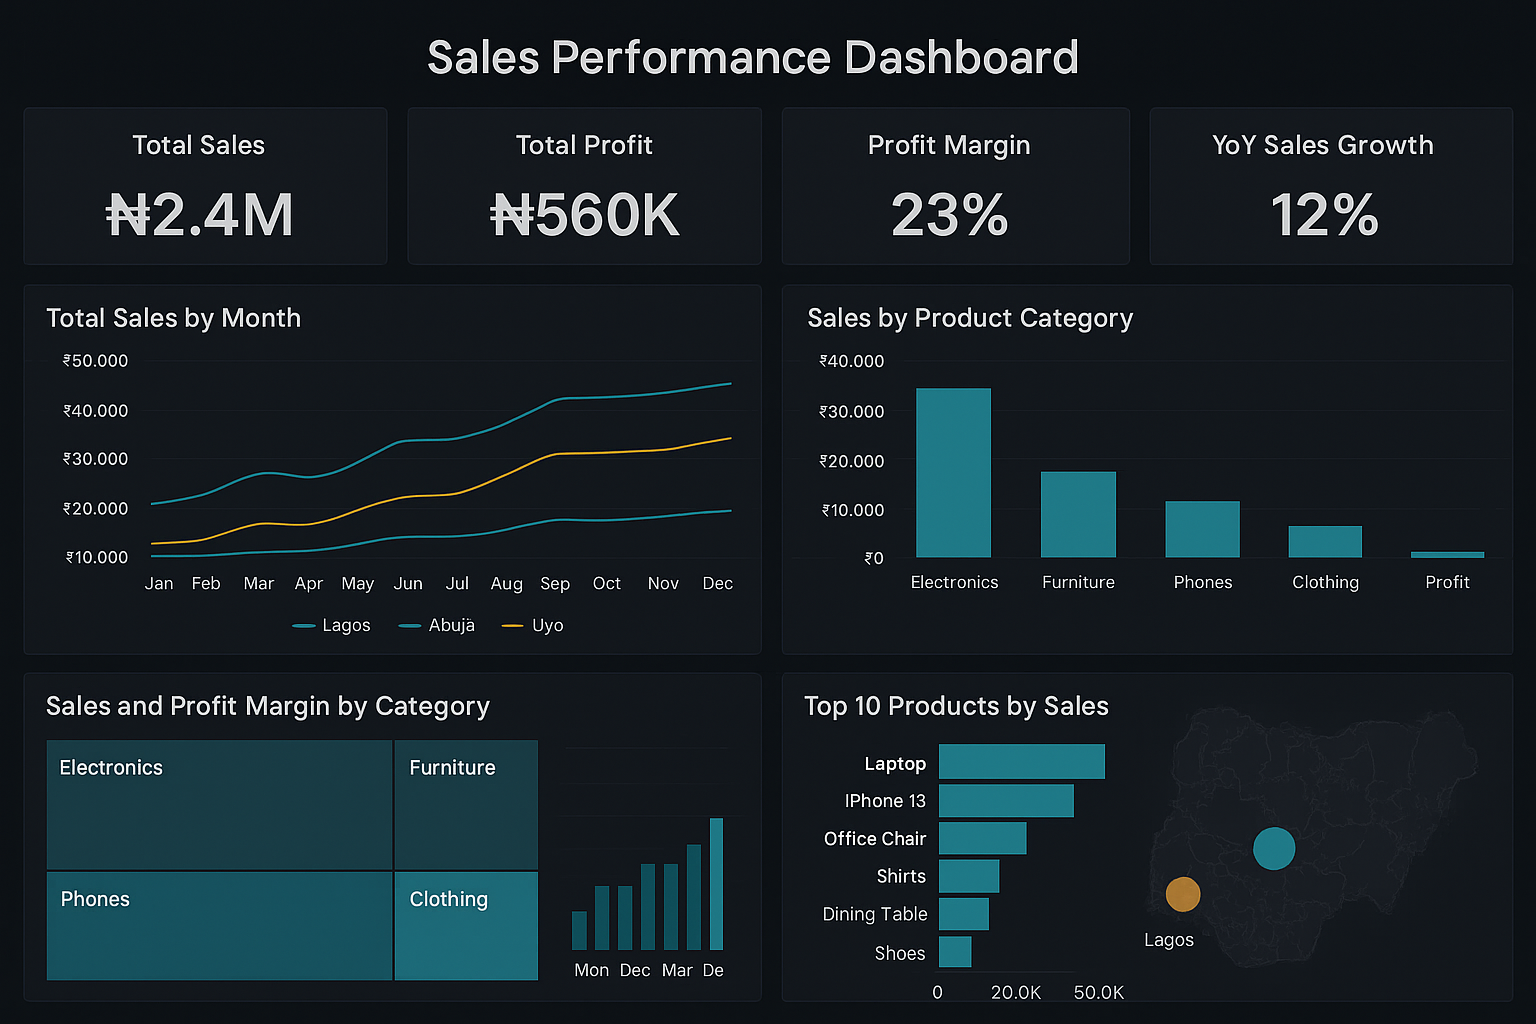
0% Profit Increase
0x Faster Reporting
Excel + Power BI + DAX
Steps Taken:
- ETL: Merged monthly sales from Excel files in Power Query.
- EDA: Analyzed sales by region, category, and seasonality.
- MODELING: Created DAX measures for YoY growth and profit margin.
- VISUALIZATION: Built interactive drill-down dashboard.
Result: Leadership now tracks top-performing SKUs in real-time.